The Testkube Dashboard
The Testkube Dashboard provides a centralized user interface for managing your Testkube Installation. The Dashboard
is included in the Testkube Control Plane and available after installation either via local port-forwarding using the
testkube dashboard command or via the NGINX Ingress Controller - Read More.
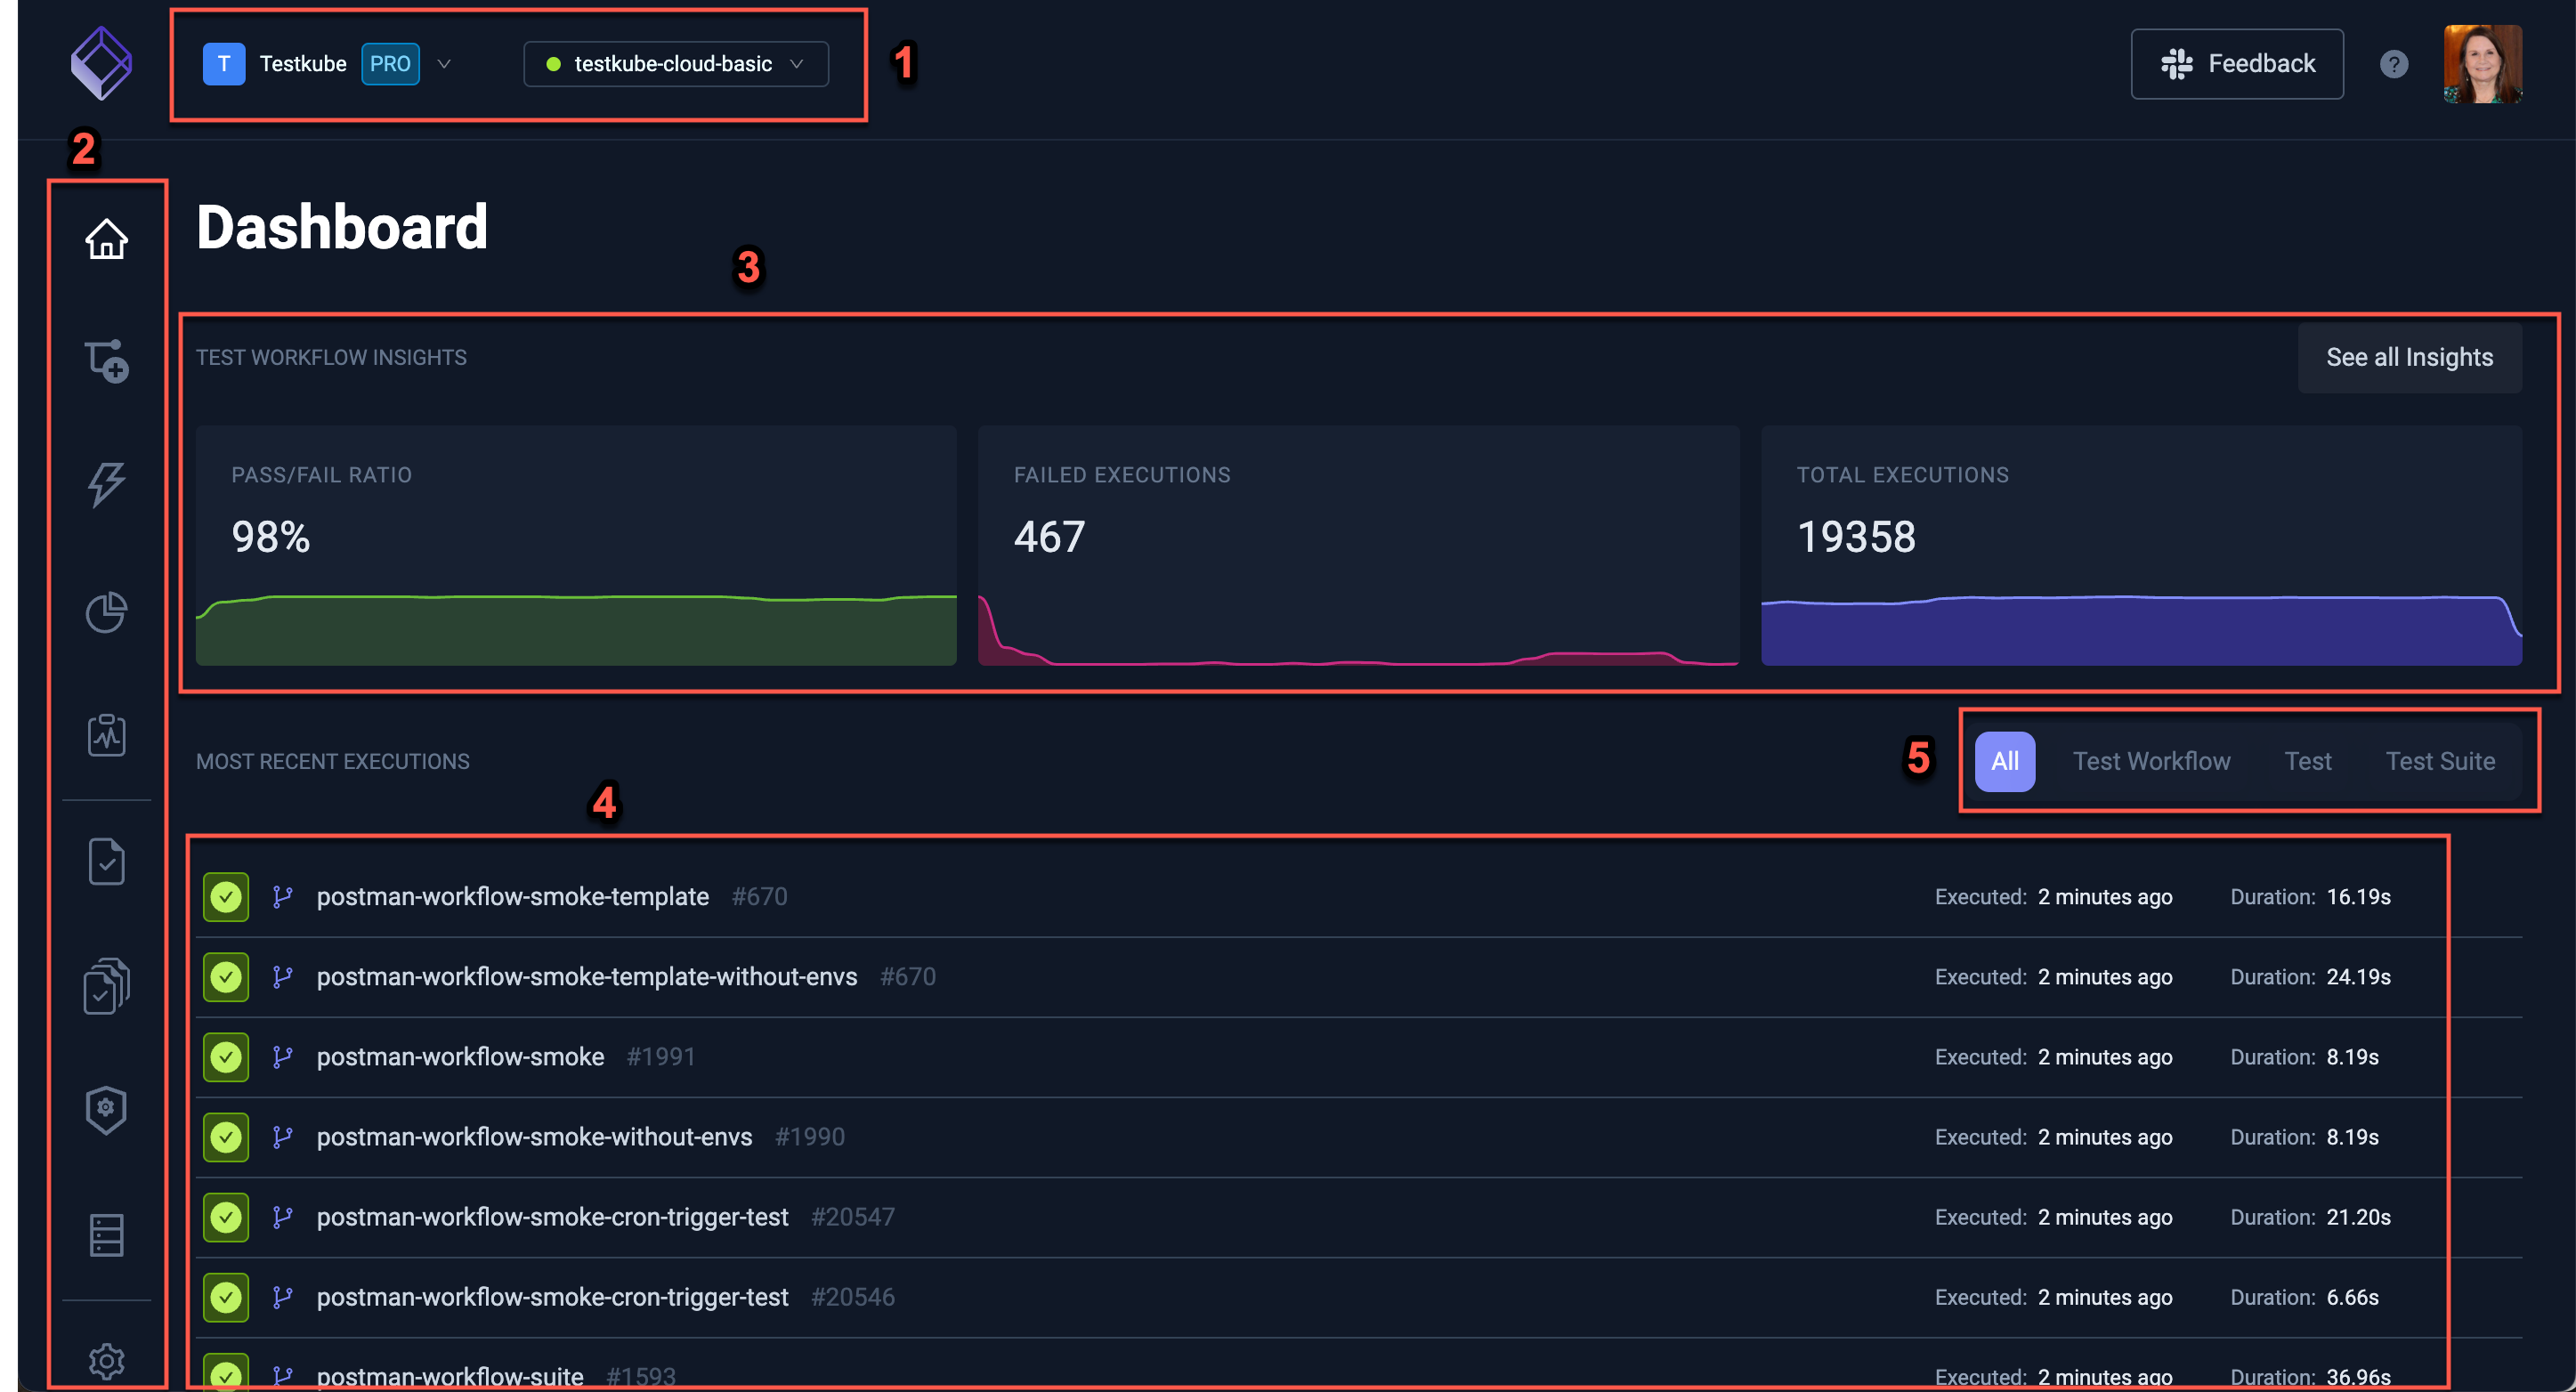
When opening the Dashboard you will be presented with the following layout:

The toggles at the top of the screen (1) allow you to choose the Organization and Environment currently shown in the Dashboard.
See the documentation on Organizations and Environments for more information on how to manage your Testkube Instance.
The navigation on the left (2) of the screen contains buttons for (in top-to-bottom order):
- Environment Overview - see below.
- Test Workflows - Read More
- Integrations - Read More
- Test Insights - Read More
- Status Pages - Read More
- Tests *
- Test Suites *
- Executors *
- Sources *
- Settings - Read More
(* are deprecated and not shown if you have them disabled, Read More)
Environment Overview
The top left icon takes you to an overview of the currently selected environment, as shown above.
It contains:
- An overview of the Pass/Fail Ratio, the number of Failed Executions and the Total Executions (3).
- A scrollable list of most recent executions (4).
- Filters for narrowing down on specific types of executions (5).
Selecting an execution opens the corresponding Execution Details